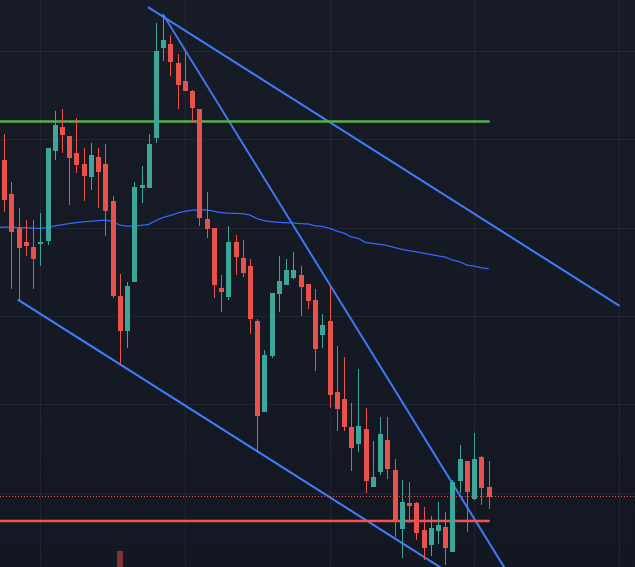
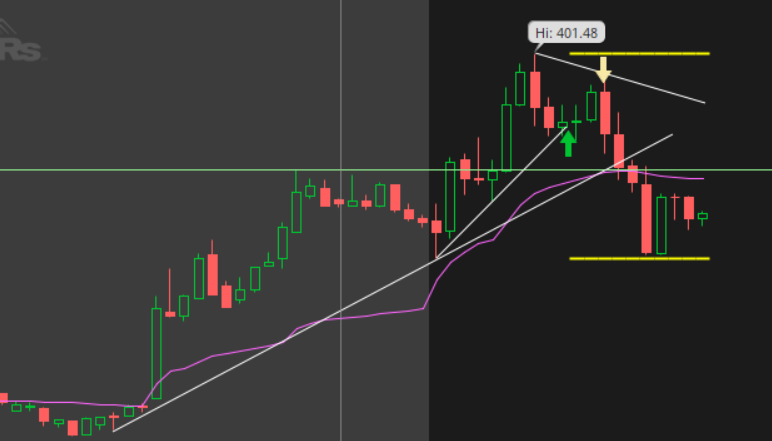
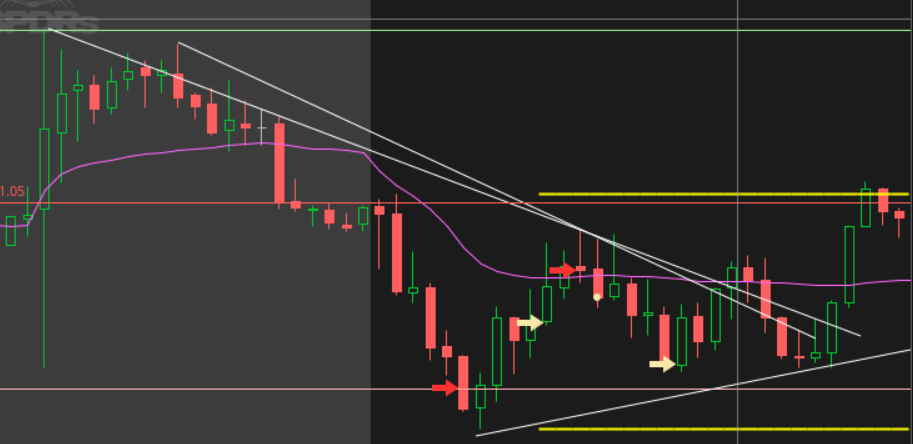
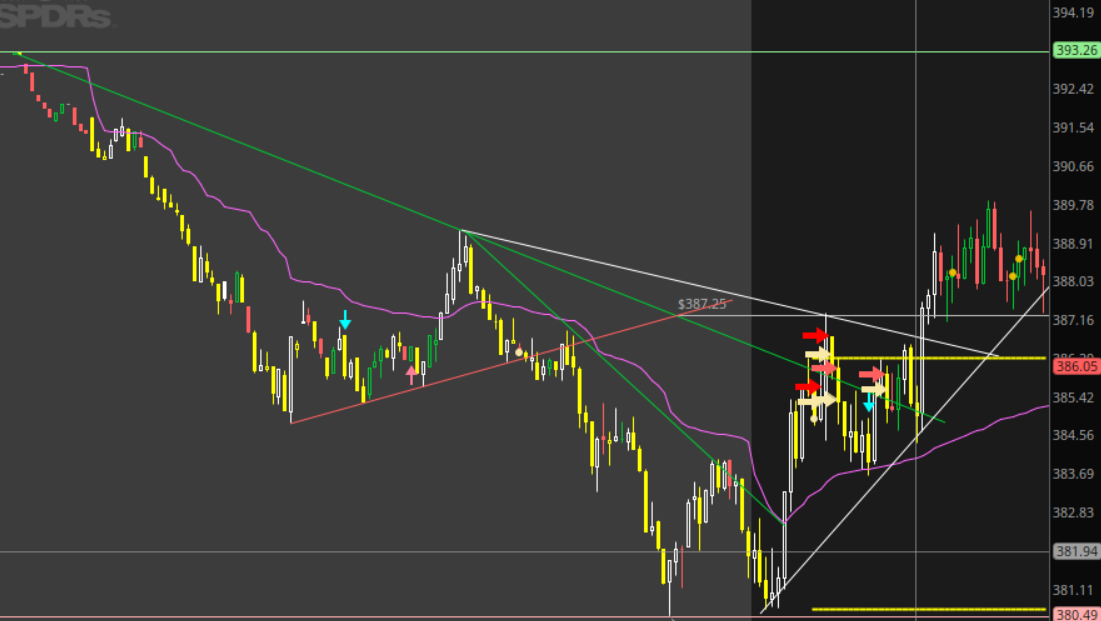
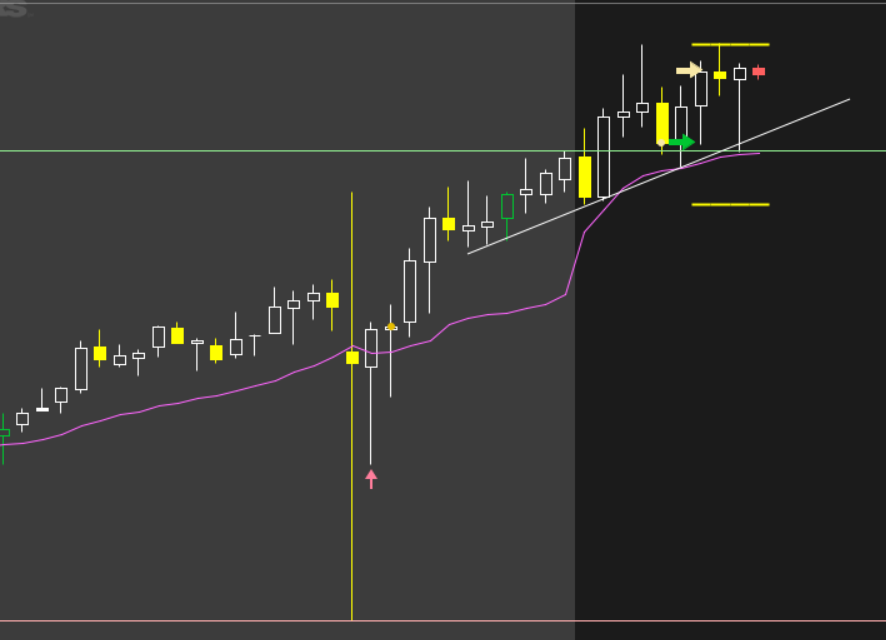
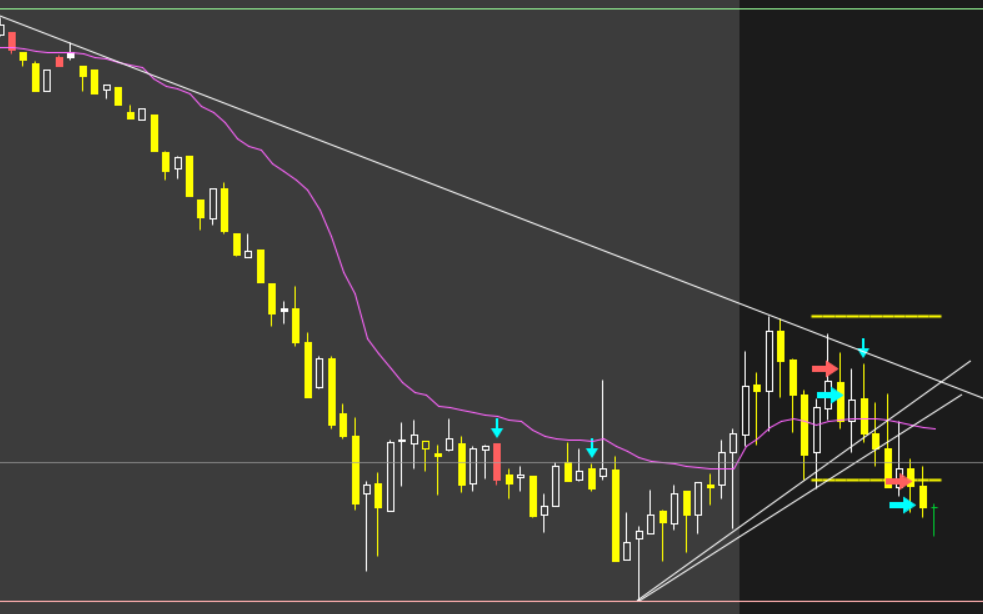
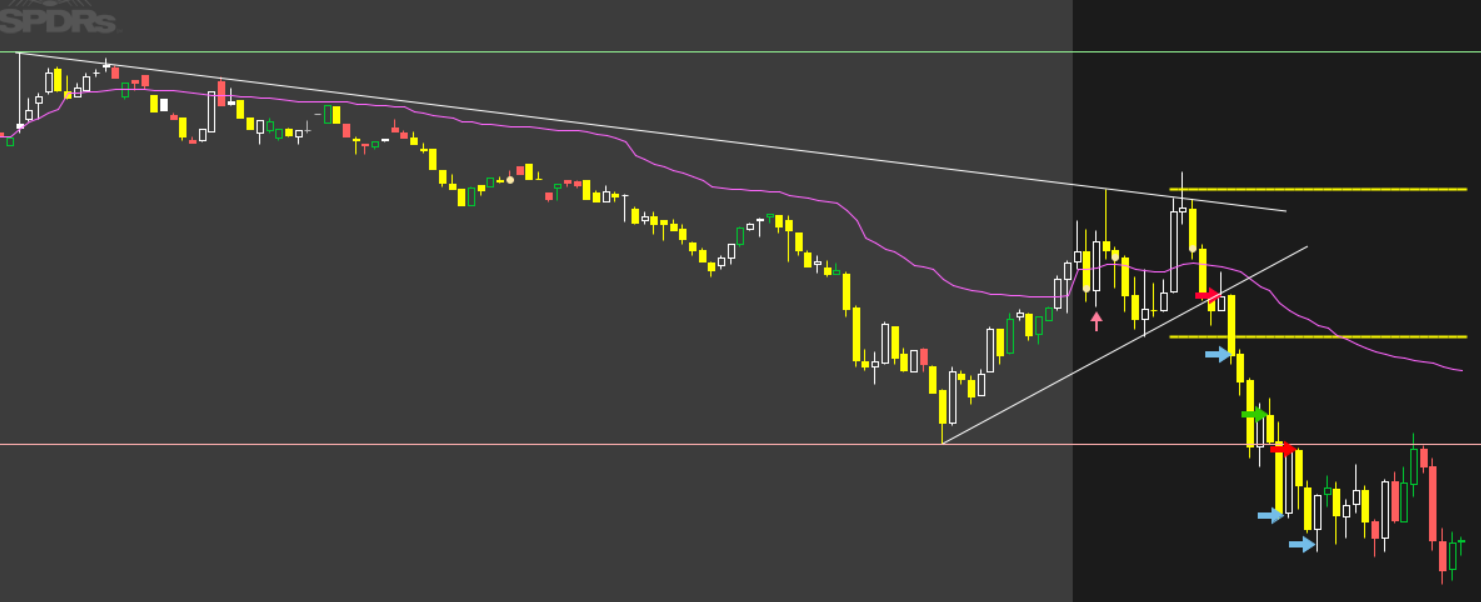
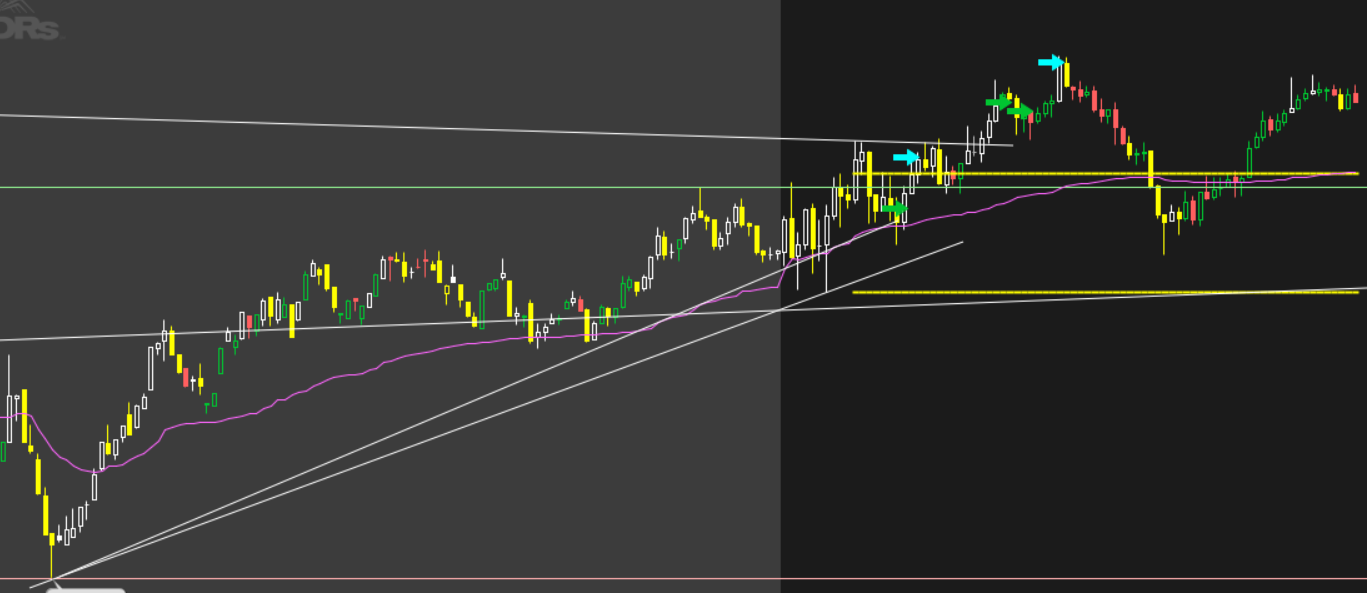
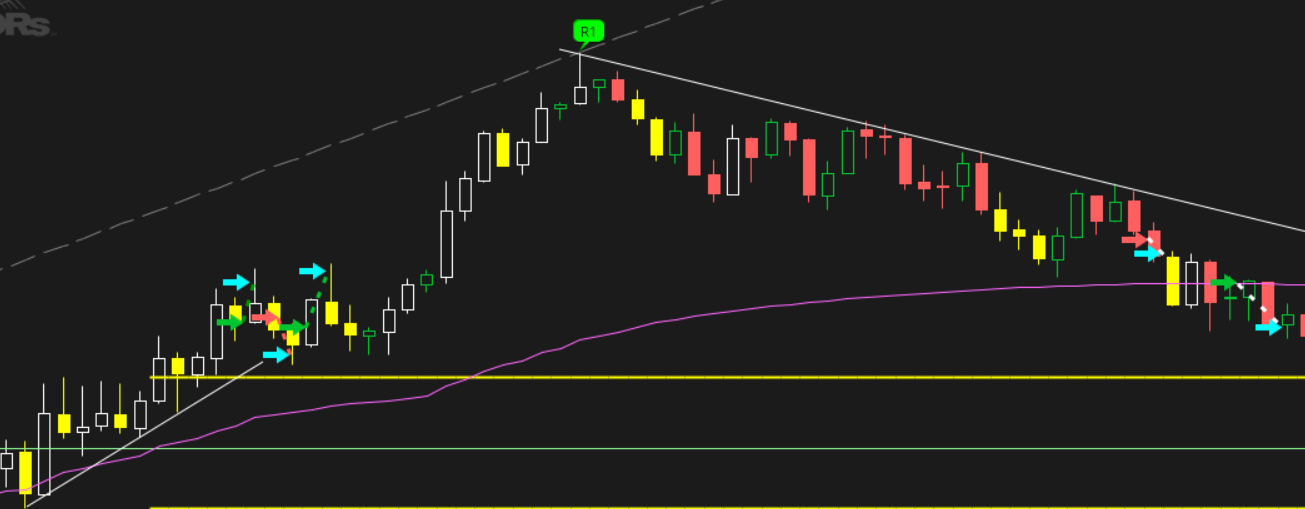
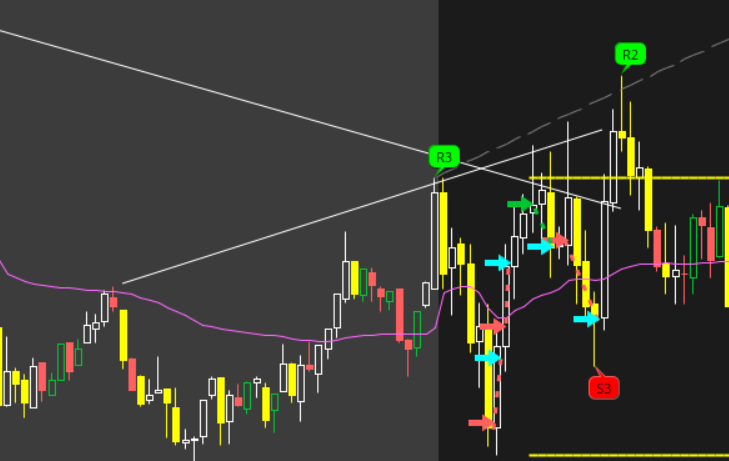
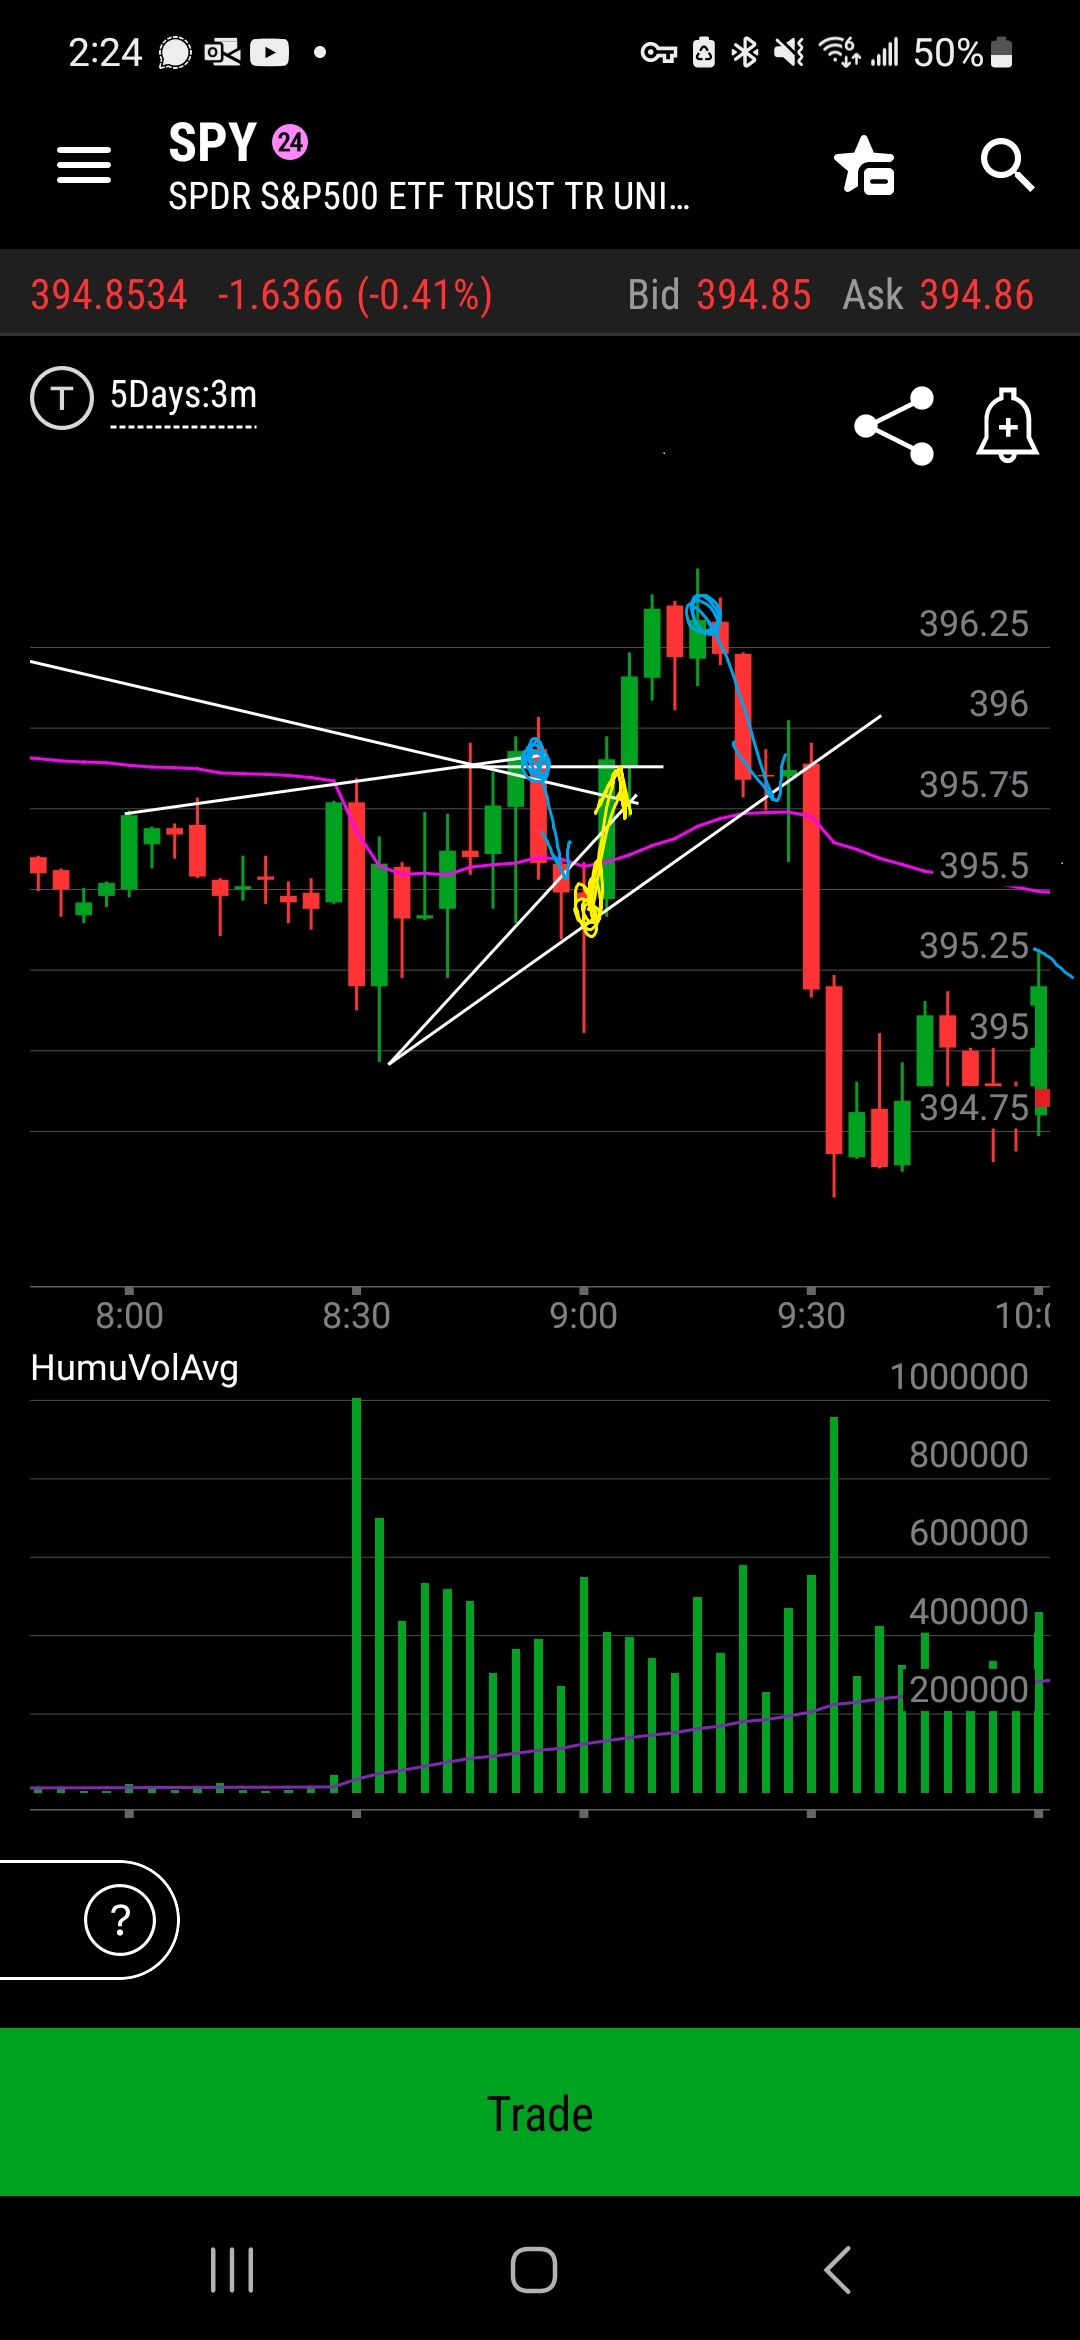
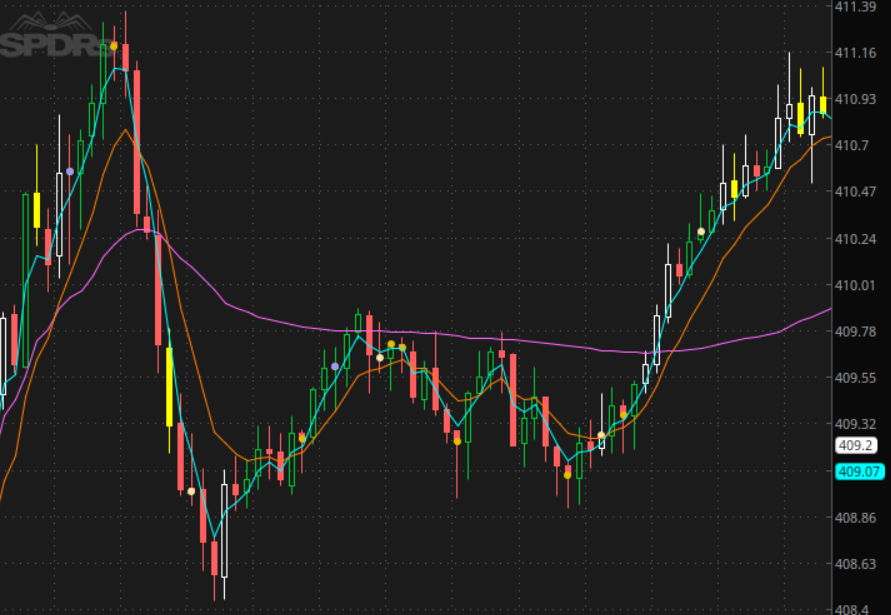
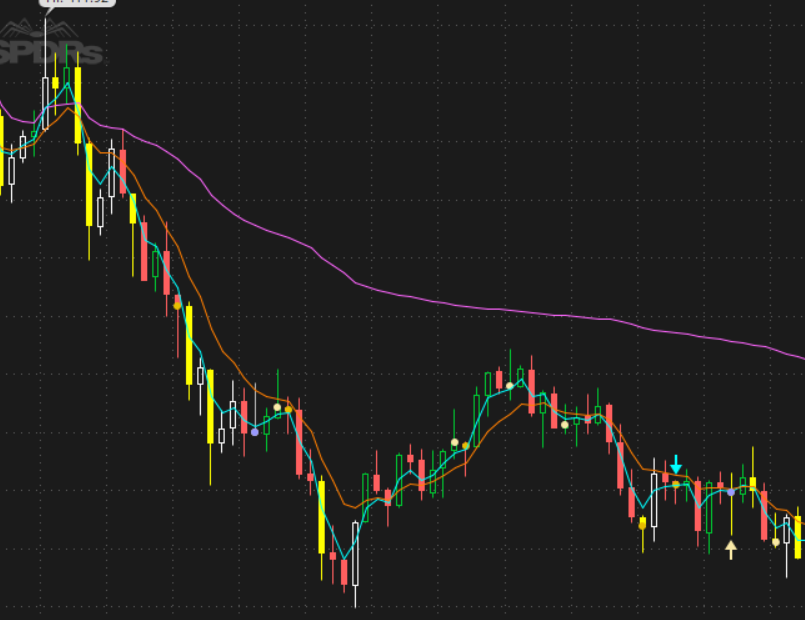
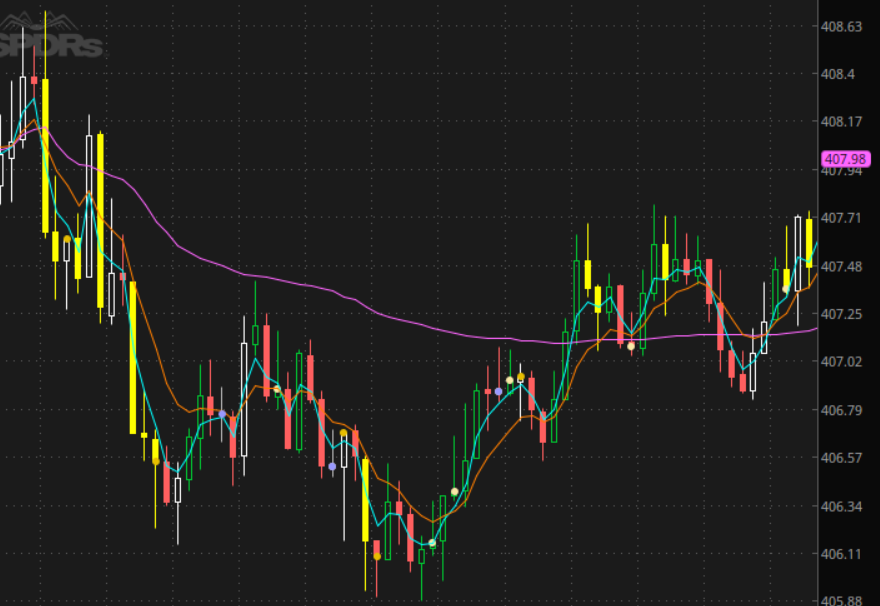
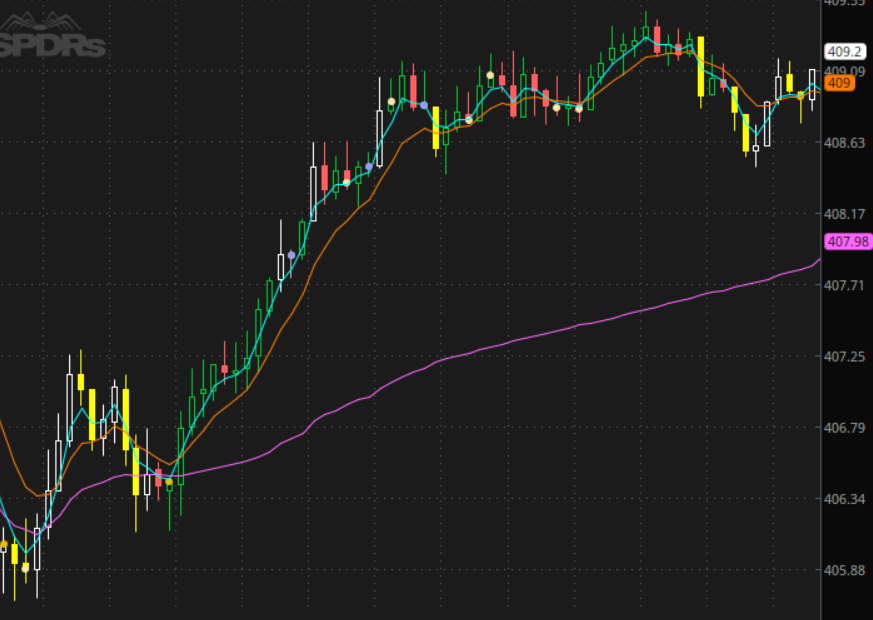
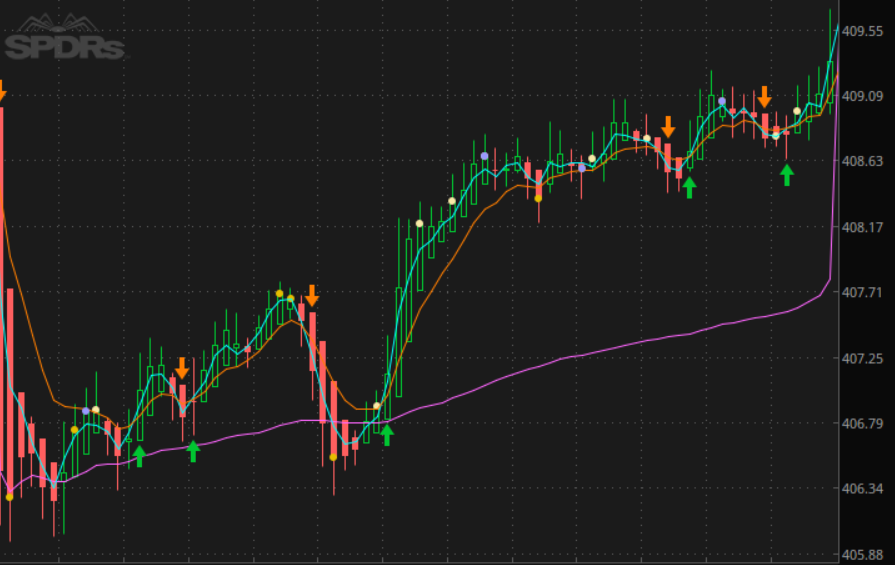
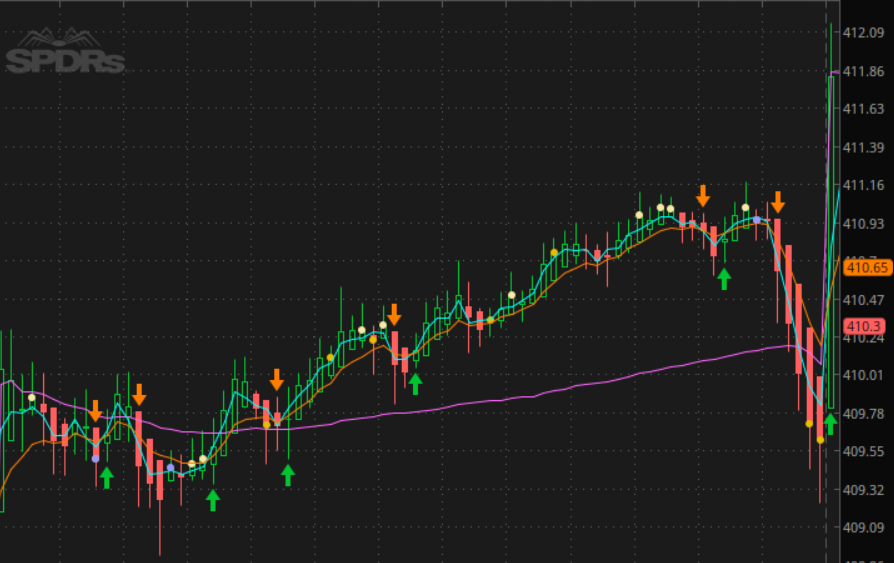
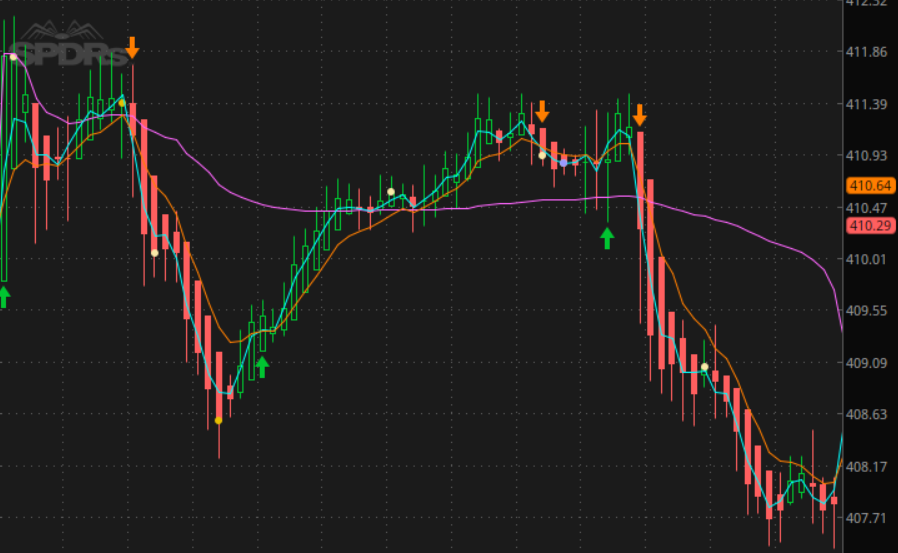
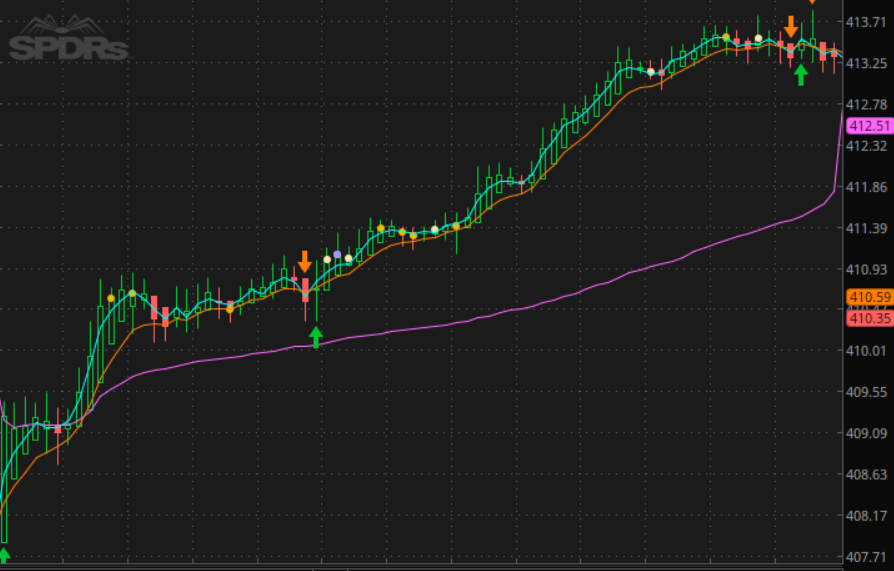
Current SPY chart: 3 min
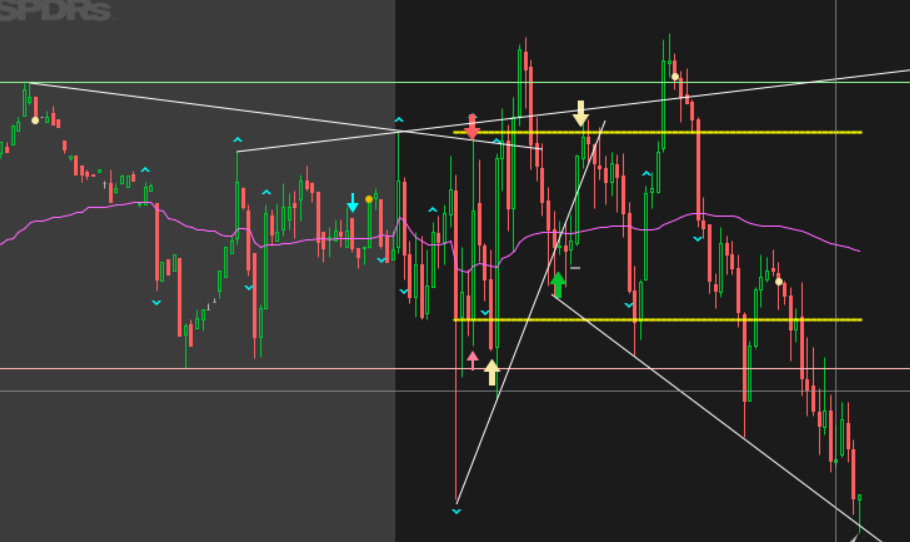
Calls, green to blue. Puts, red to blue
Because positions were kinda close, I drew dotted lines to maybe help distinguish when about each trade happened.
Trade: SPY calls
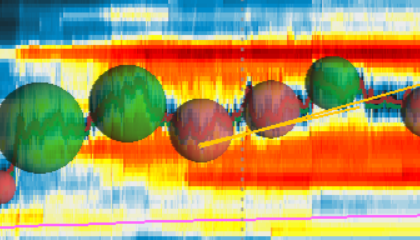
Buy Reason: Noticed price ascending on the 3 min (on the 5 min it is kinda steep). Chart showed a red candle, but the bookmap showed that the CVD was still ascending + higher lows + all the liquidity was much higher.
Sell Reason: Trimmed when price hit profit target.
Was considering selling immediately on the high liquidity, but the thought was that it might break through it especially with the clear ascending price. Touched the liquidity area, pushed down, then attempted to push again, with a lower high = exit the rest. Still above target so I was fine with getting lower than optimal fill.
Trade: SPY puts
Buy Reason: Higher liquidity pushed it down lower, drew a small line on the bookmap connecting the highs, then when it hit the line again, it pushed down again (3 touches on the small trend line, on the third touch and rejection) = entry
Sell Reason: Trimmed on profit target.
There was no liquidity below that would act as support (or target to exit) so I kept on holding the rest until I saw it trying to push back up. Higher low = exit
Trade: SPY calls
Buy Reason: Hit the 3 min trend line (not the minor ones from bookmap), but price was already ascending from the higher lows. Drew trend lines from lows on bookmap. Once again, on the third touch of the trend line, it pushed up + it pushed above the minor downward line = entry
Sell Reason: Trimmed on profit target.
Touched that higher liquidity again = exit
Trade: SPY put
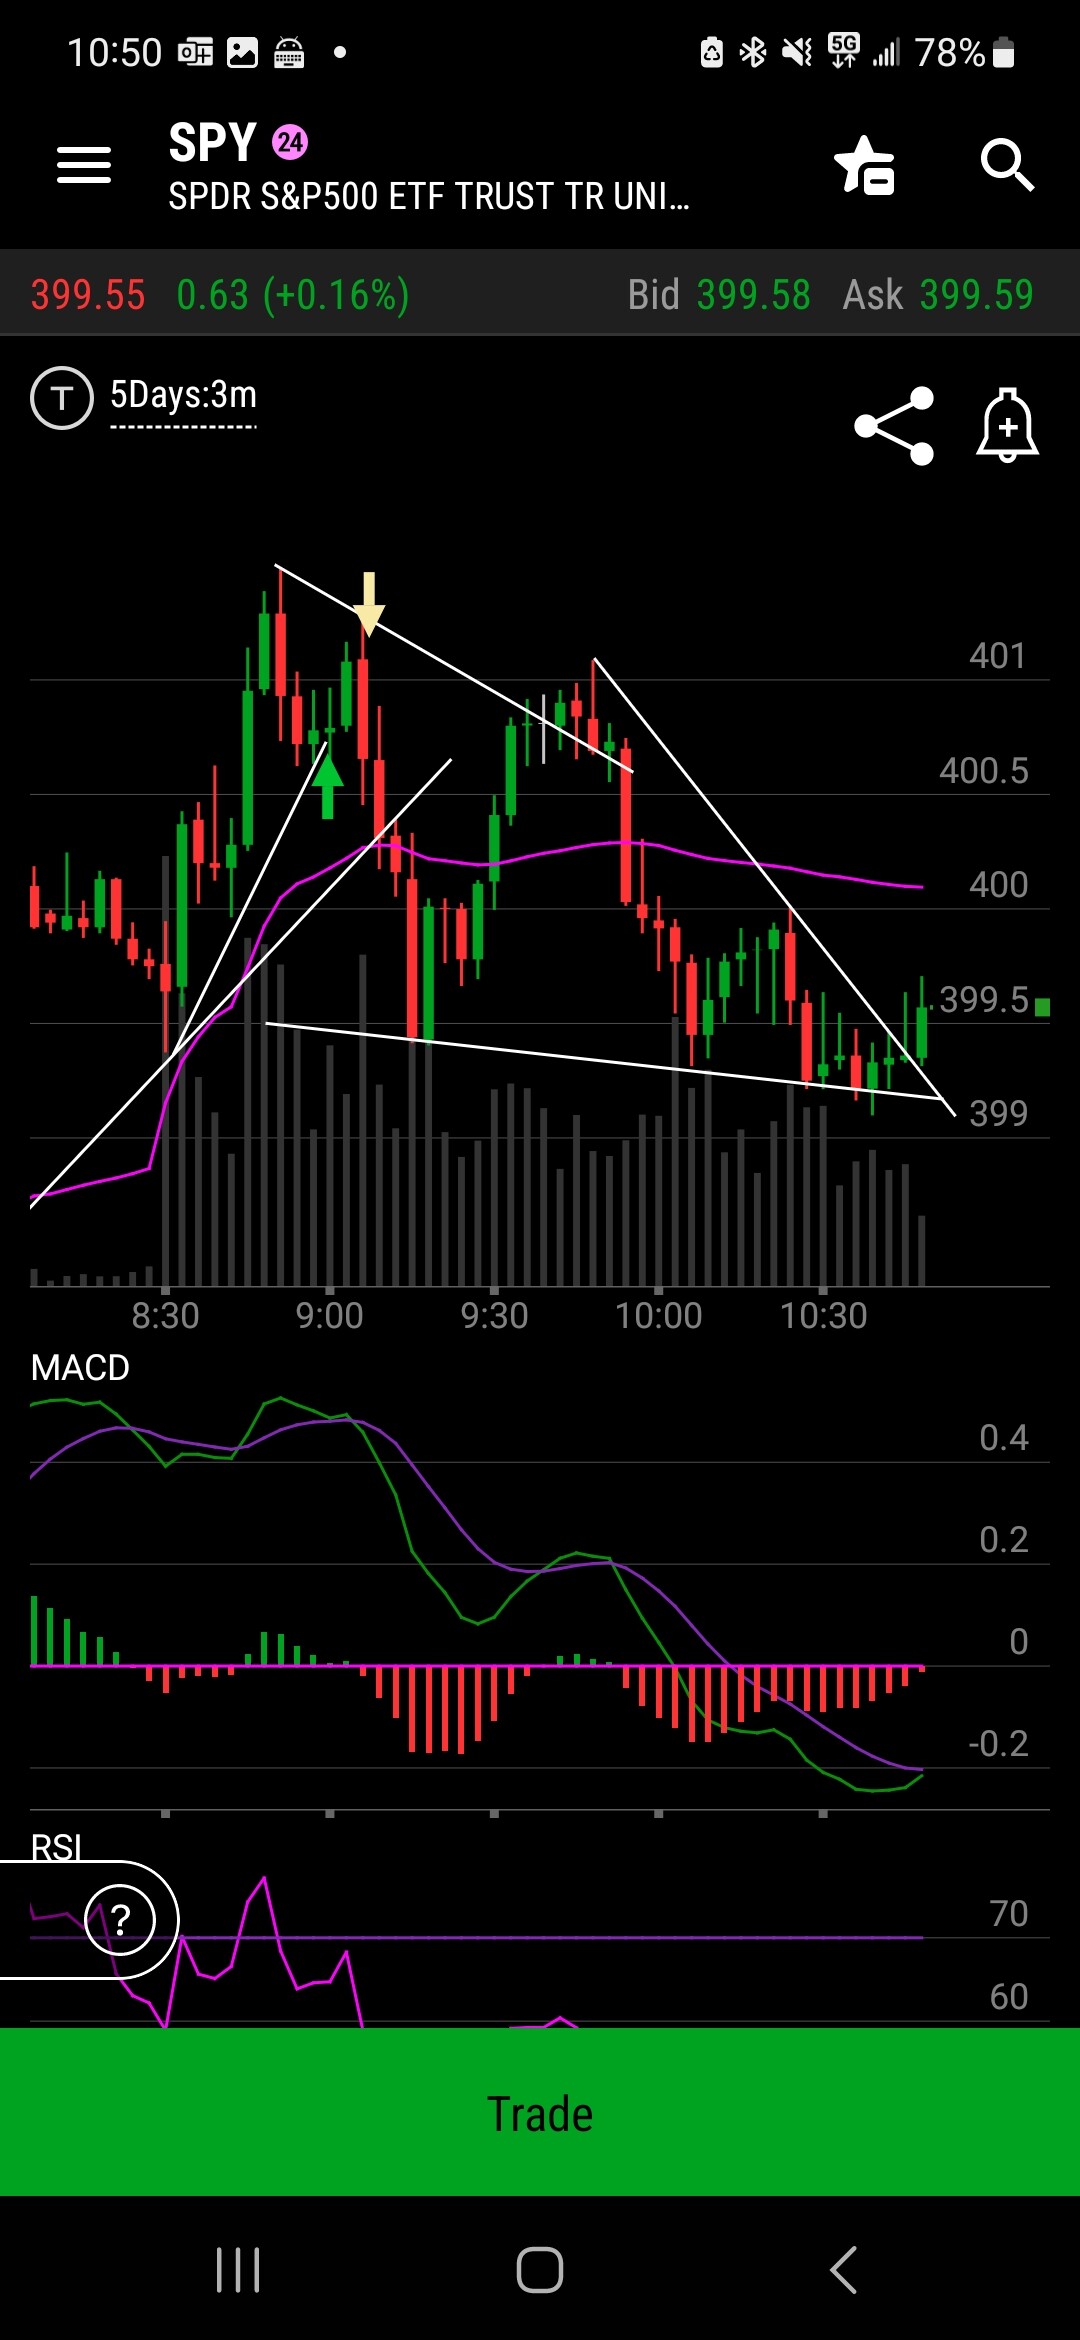
Buy Reason: Price descending, touched that trend line for the 4th time, rejected again
Sell Reason: Hit profit target
Trade: SPY call
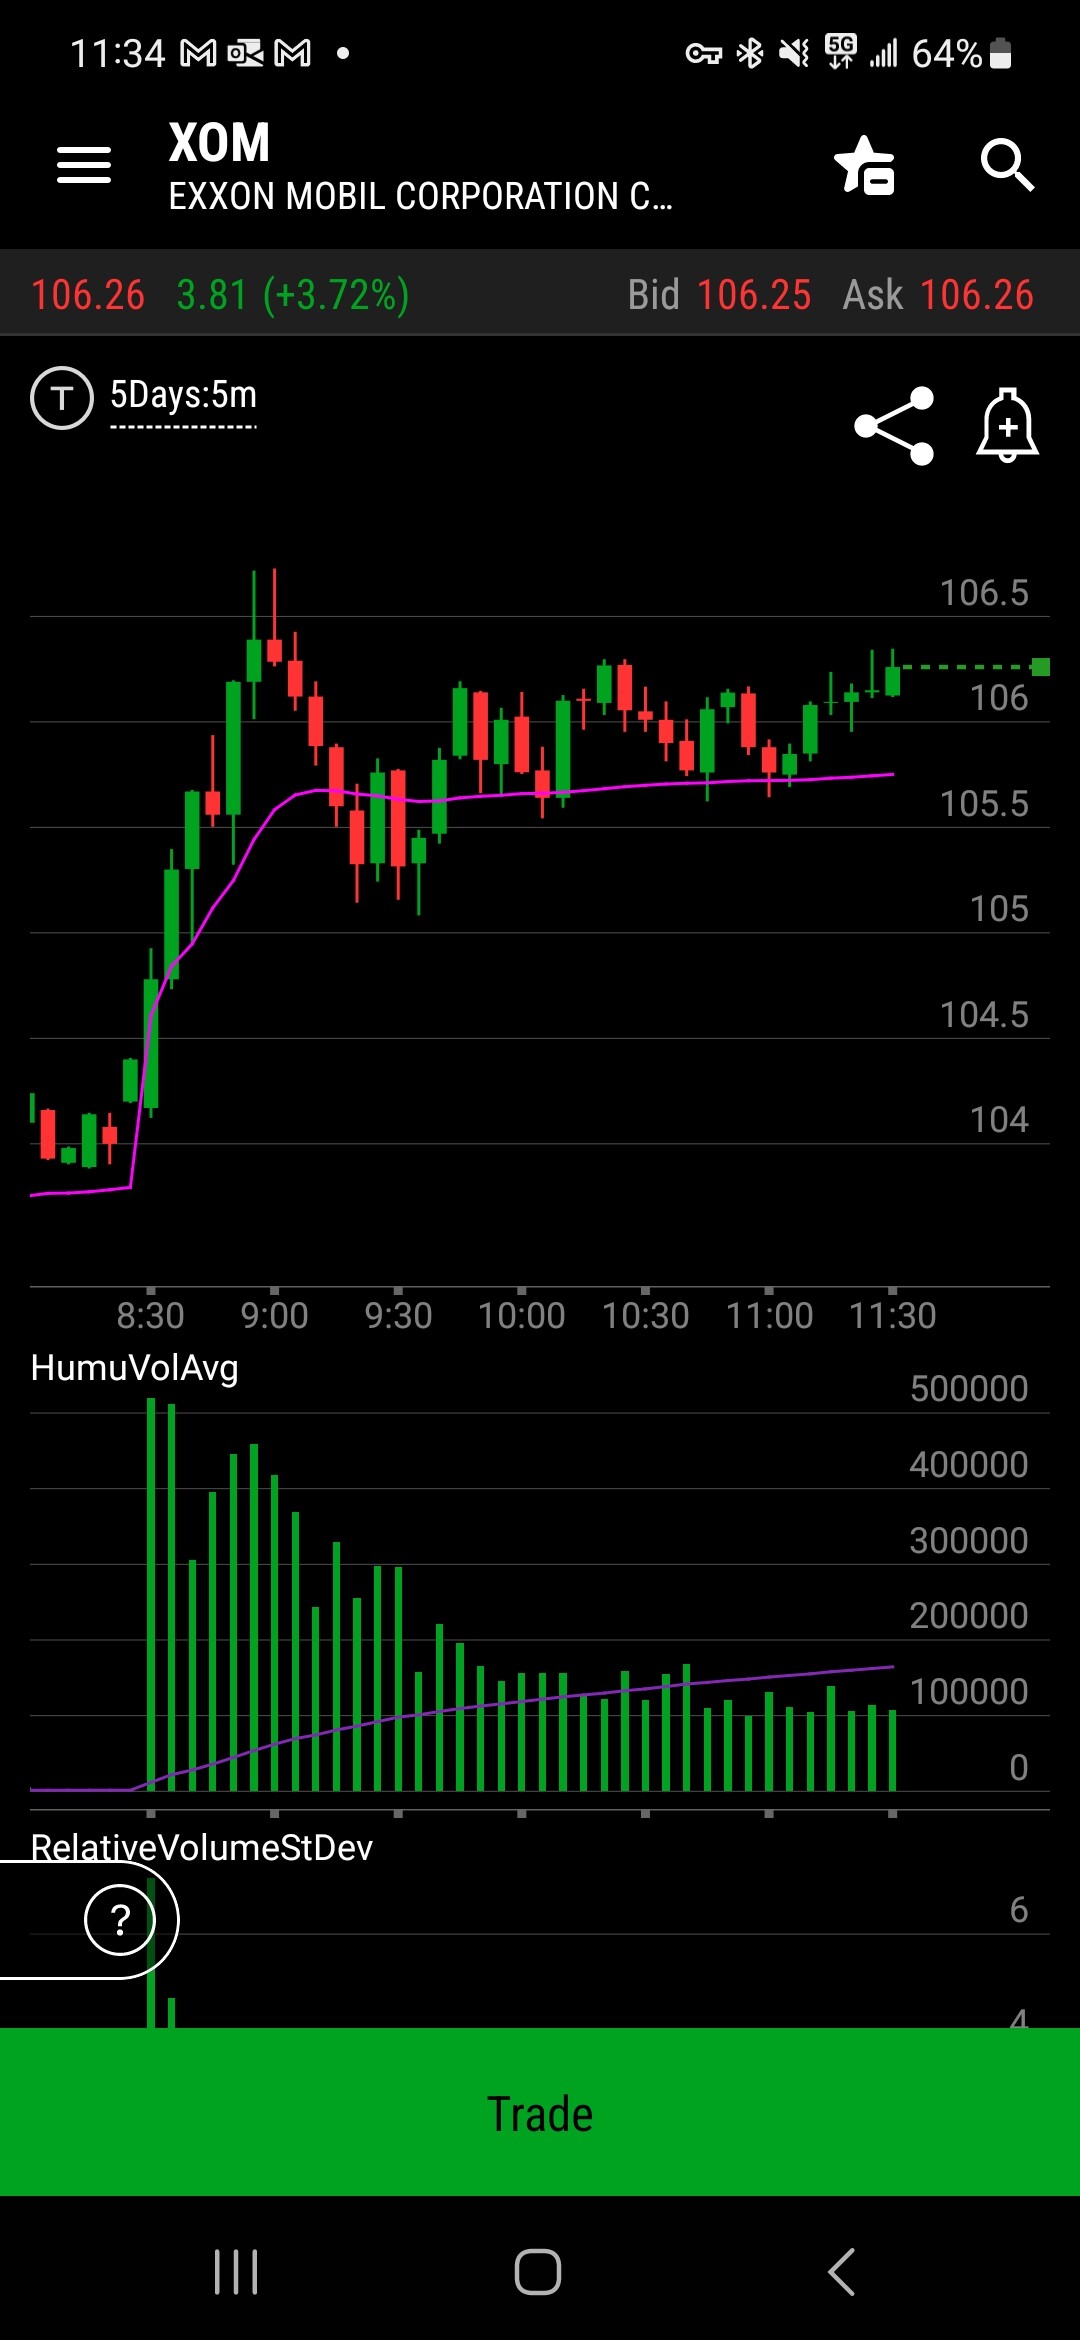
Buy Reason: 5 min showed a hammer candle, that’s it. Thinking back, can’t really find any other reason.
Sell Reason: Stopped out.
Maybe prolly i guess a bit too aggressive in the morning, going calls, then sell and flip immediately to puts, then immediately again into calls.
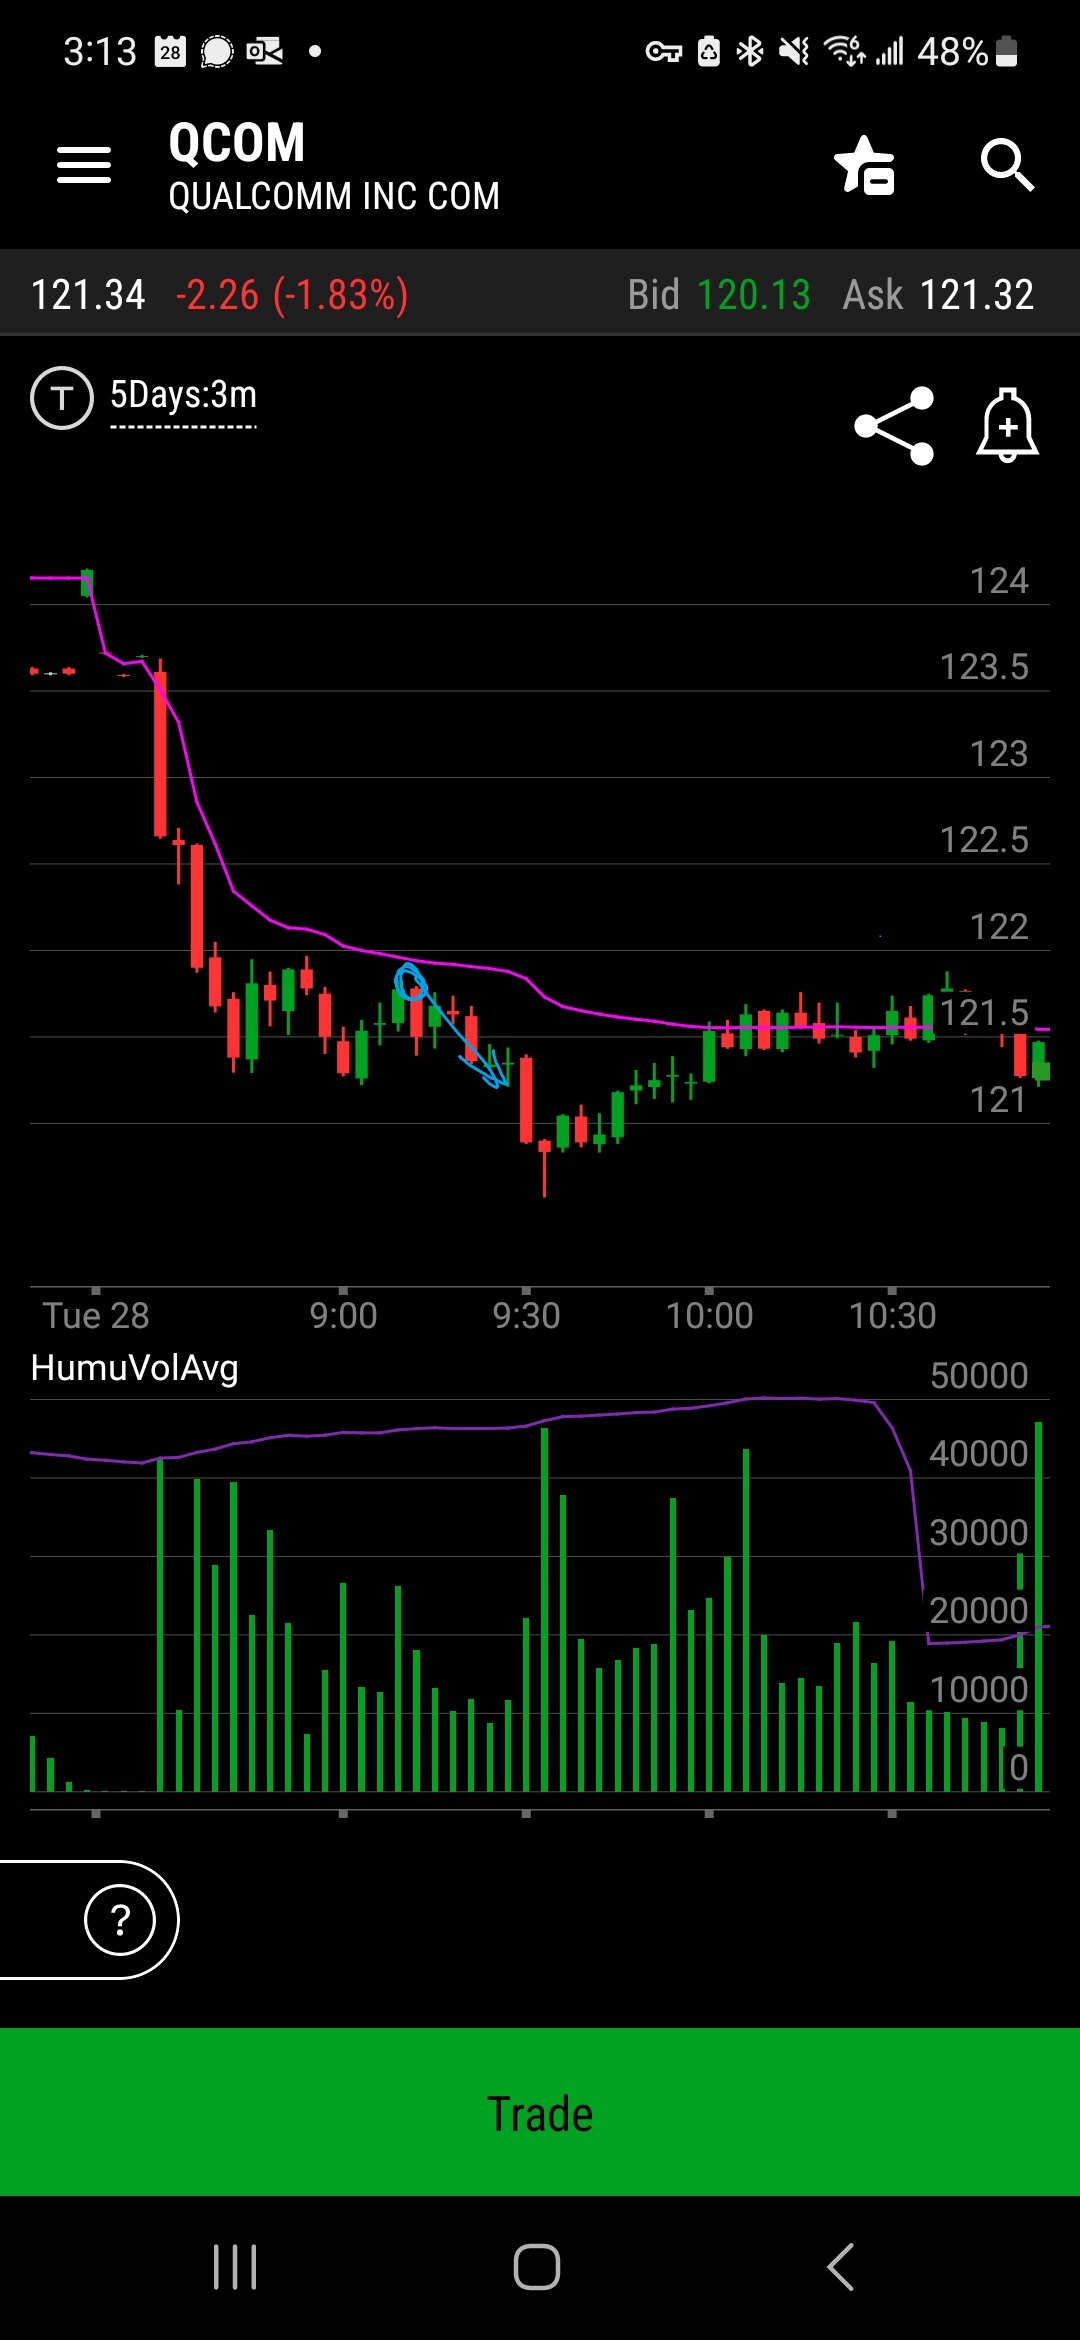
Afternoon, traded via phone, so no bookmap to let me peek into level 2 data. Probably should’ve stuck to puts until I saw that trend line break upwards.
Maybe stick to trend trading, i.e. trade in the direction that my lines are drawn.
Or if I do counter the trend, needs to have multiple reasons that align, i.e. high liquidity rejection + lower high, but even then, exit quickly
I’m thinking of moving to view strictly on the 3 or 5 vs viewing it concurrently with bookmap, and only using the bookmap to confirm movement or entries and for exiting. That way, hopefully the trades will be less aggressive, in the direction of the trend, and more spaced out, rather than trading in and out every 3-5 min candle.
Now, trimming into profit rather than exiting immediately into profit because, reviewing the past few trades, most continue for a while, then reverses, and some, the rest of the day. Which meant that I am basically exiting before the big move happens. Trimming = locking in profit = the rest is basically a free position = less concern if it reverses but great if it continues the trend.